Superposition options
There is now an option in V7.1 onwards that allows users to conduct Superposition runs with different doses and dosing intervals.
Unfortunately, there are certain profiles that are so poorly defined, for a variety of reasons, such
that full modelling of the data is inapproriate. In these circumstances it can be useful to predict repeat
dose profiles based on half-life alone. Mainly due to popular usage, the Superposition module has again been further updated by the author
(now re-written in Fortran for speed) and also verified by two independent users in addition to many others who have tested it for accuracy and validity. In addition to being able to vary the dosing interval, users can still change each dose across the entire regimen as well (thanks to suggestions by Angus McLean, Ph.D., in the USA and Dr med. Christian de Mey from ACPS in Germany).
There are still various plots of the Superposition results together with a selection for accuracy/time increments to dictate the number of points
required for each run. Using the highest accuracy (0.001) which can take some time (transferring so many numbers into Excel) although the Fortran
module is much quicker for longer repeat dose regimens wherein; up to 100 doses can now be defined) there can be up to 1,000,000 points
generated which is getting close to the number that Excel can handle without messing around too much. The author recommends a value of
either 0.1 or 0.01 which is a very good compromise.
Summary Superposition plots and values for parameters such as Cmin, Cmax and AUC are still output for each dose. There is also a Summary table
within the spreadsheet indicating the accumulation values by comparing parameters from Dose 1 to the last Dose for a quick assessment.
In addition (new to V7.1 onwards) the user can now manually override the estimated half-life value when required (sometimes useful for
very sparse data but when the half-life is known) and can now add their own data points to the repeat dose plots very easily,
if required, which is particularly good for showing pre-dose values at later time points within a repeat dosing regimen.
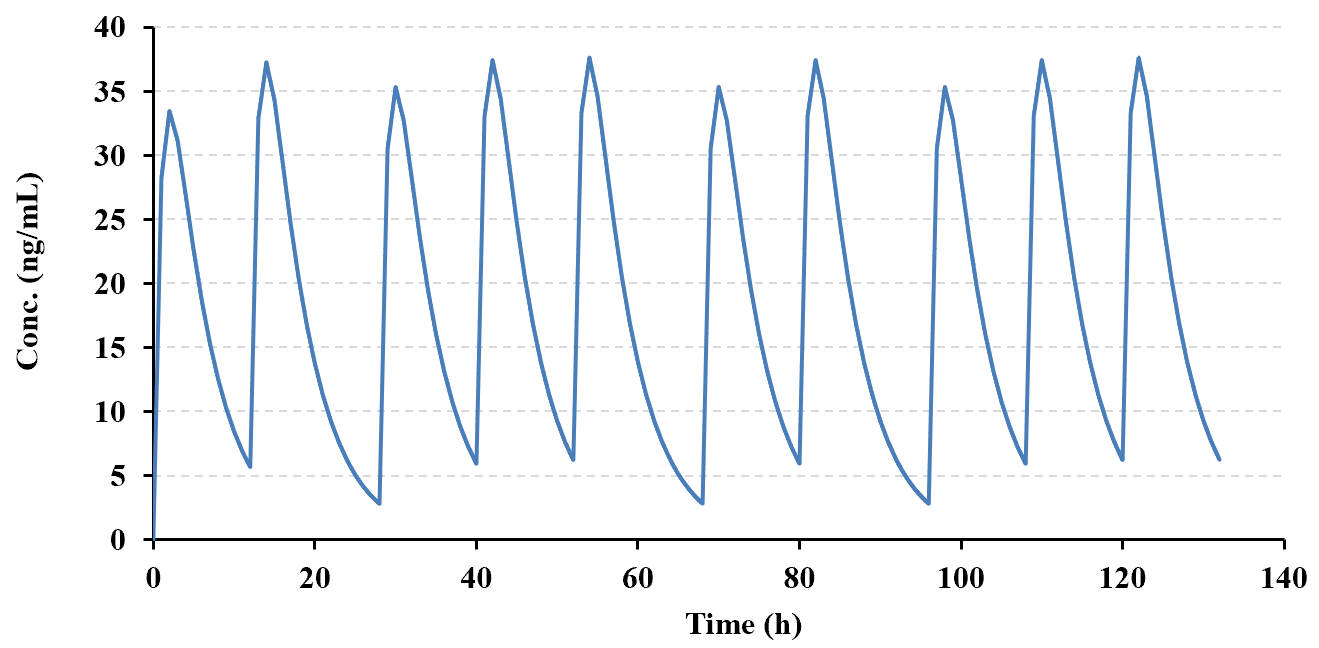
The example below (copied directly from the PCModfit 'Superposition' spreadsheet) shows the results
for a predicted repeat dose scenario (10 doses) based on a half-life (user selected points, n=7) of ca. 3.5 h (program
generated) using different doses and dosing intervals. The spreadsheet is updated when the module is run and shows
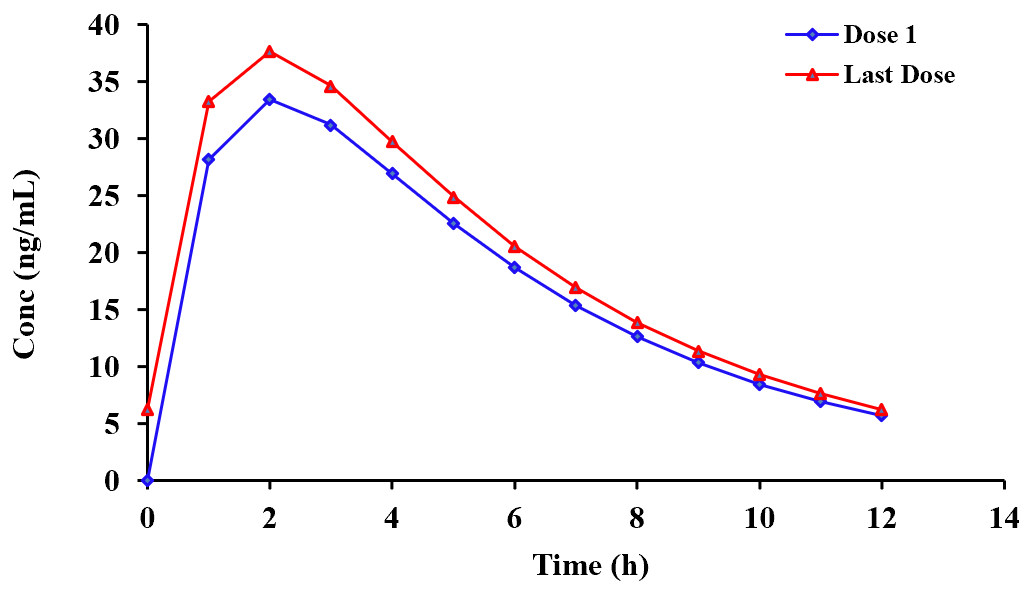
considerable information in the form of plots and Cmin, Cmax and AUC after each dose. Another plot that can be useful for a variety
of reasons is shown below (1st and last dose). There is also a summary table that specifies the actual data point times for the 1st
and last doses. This can save a lot of time as to extract these manually, from the many thousands of values calculated, can be very prolonged.